


How HWGrow Tests Nutrients: pH, EC and PPM Protocol

Last updated: August 2026
Quick answer: HWGrow’s comparison protocol mixes 1 mL of liquid nutrient or 1 g of dry product into 500 mL of reverse-osmosis water, then records the water’s pH and conductivity-based PPM before and after mixing. The method is useful for comparing how products move a controlled water sample. It is not a feeding schedule, a chemical assay or proof that one bottle grows better plants.
Video chapters: the HWGrow test protocol
- 0:00 — Why the procedure is standardized
- 0:08 — 1 mL or 1 g in 500 mL
- 0:26 — Graduated cylinder and micropipette
- 0:35 — Tared scale for dry products
- 0:40 — Initial and final PPM on the 500 scale
- 0:55 — Initial and final pH
- 1:10 — Cleaning between products
- 1:17 — Single-use pipette tips
- 1:22 — What the result is meant to show
Selecting a timestamp opens the video at that moment without moving you away from this section.
The most important correction: it is 500 mL, not 50 mL
The old written page said every product was added to 50 mL of water. The original video and source transcript both specify 500 mL. That tenfold difference completely changes the concentration, so this page now uses the video-verified amount.
| Liquid-product screen | 1.00 mL product + 500 mL RO water |
|---|---|
| Dry-product screen | 1.00 g product + 500 mL RO water |
| Equivalent rate | 2 mL/L for liquids or 2 g/L for dry products |
| Primary outputs | Change in pH and change in EC/500-scale PPM |
Liquid and dry products are reported separately because 1 mL and 1 g are not interchangeable doses. The fixed ratio is a comparison condition—not a recommendation to feed every product at 2 mL/L or 2 g/L.
What the meters are really measuring
pH: acidity at that moment
pH records how acidic or basic the sample is after mixing and settling. It can show that one product pushes low-alkalinity water farther than another. It cannot predict how a buffered tap source, substrate, root zone or complete multi-part recipe will behave over time.
EC: total electrical conductivity
Electrical conductivity measures how readily the solution carries current. Dissolved fertilizer ions usually raise EC, which makes it a useful concentration check. But EC does not identify which ions are present, whether the nutrient ratios are appropriate or how much of each element a plant will absorb.
PPM: an EC conversion, not a lab count
A handheld TDS meter measures conductivity and converts it to a displayed “PPM” value. Different conversion scales produce different numbers from the same EC. HWGrow’s original comparison used the 500 scale, so every result must keep that scale attached. For cross-brand comparisons, EC in mS/cm is the cleaner common language. The pH, EC, TDS and PPM guide explains the conversions.
Updated step-by-step protocol
- Record the product. Capture the full name, formula, lot number, manufacture/purchase date and whether it is liquid or dry.
- Condition and calibrate the meters. Follow each meter’s calibration and storage instructions. Record the calibration standards and date.
- Control the water. Use the same reverse-osmosis source for a comparison batch. Measure 500 mL in a clean graduated cylinder.
- Record the baseline. Measure water temperature, pH and EC. If displaying PPM, record the conversion scale.
- Measure the product. Use a calibrated P1000 micropipette for 1.00 mL of liquid or a tared 0.01 g scale for 1.00 g of powder.
- Add and mix consistently. Use the same vessel, mixing time, intensity and rest time for every product. Confirm that dry material has dissolved before reading.
- Measure the final sample. Rinse the probe as directed, record final pH, EC and temperature, then calculate the change from baseline.
- Prevent carryover. Clean and dry the vessel between products. Use a fresh pipette tip or clean measuring tool for every product.
- Repeat the run. For stronger comparisons, run at least three independently prepared samples and report the mean plus the observed range.
Data table to publish with every nutrient test
| Field | Why it matters |
|---|---|
| Product, formula and lot | Manufacturers can reformulate; the lot identifies what was actually tested. |
| Liquid or dry | Prevents readers from treating 1 mL and 1 g as equivalent. |
| Water source and volume | Keeps the comparison base visible and repeatable. |
| Water temperature | Meter response and conductivity compensation depend on temperature. |
| Initial pH and EC | The change belongs to the product only after the baseline is known. |
| Final pH and EC | Shows the measured condition after a defined mixing/rest period. |
| PPM scale, if used | Prevents 500-, 640- and 700-scale numbers from being compared as if identical. |
| Replicates and range | Shows whether a result repeats or depends on one preparation. |
What this test can and cannot answer
| It can help answer | It cannot answer by itself |
|---|---|
| How much did this dose change low-EC water? | Is this a complete or balanced plant feed? |
| Did the product push pH up or down in RO water? | What pH will it create in your tap water or root zone? |
| Do two meters agree closely enough to trust the reading? | Which elements or contaminants are present? |
| Does the result repeat with the same product lot? | Will the product increase yield, quality or plant health? |
Reverse-osmosis water makes the baseline clean, but its low buffering capacity can exaggerate pH movement compared with tap water. To understand your actual feed, repeat the measurement with your own source water and use the manufacturer’s labeled dose. Search your ZIP code plus “water report” to find the local utility report, then compare it with your meter and, when needed, a laboratory water analysis.
Recommended nutrient-testing tools

pH and EC meter kitMeasure both the water baseline and the final mix. Calibrate and store each probe according to its instructions.

500 mL graduated cylinderMakes the water volume visible and repeatable; read the bottom of the meniscus at eye level.

0.01 g digital scaleFor dry products. Tare the vessel and verify the scale with its calibration weight before comparing samples.
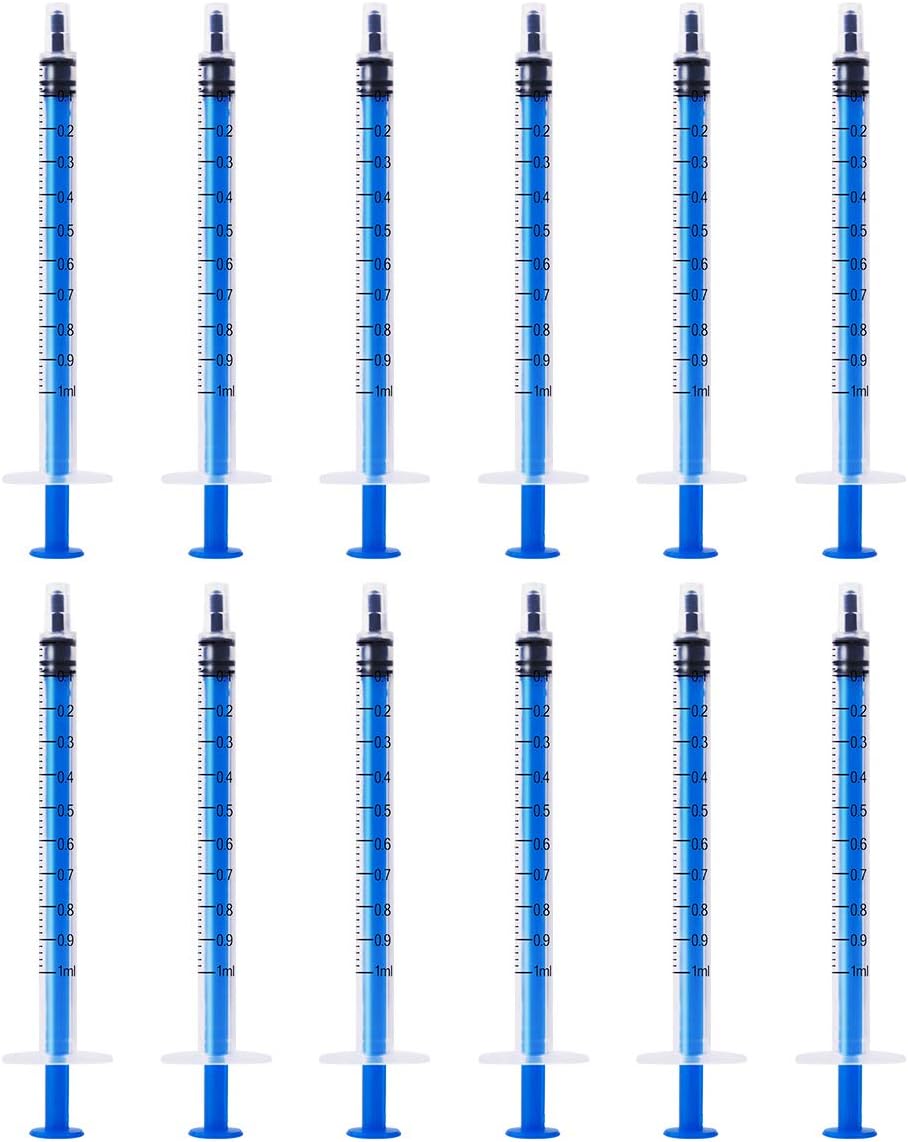
1 mL measuring syringesA practical home alternative for liquid products. Use one clean syringe per product; a calibrated micropipette is more precise.
Affiliate disclosure: HWGrow may earn a commission from qualifying purchases at no additional cost to you. Equivalent calibrated tools can be substituted without changing the test design.
Evidence and measurement references
- University of Maryland Extension: fertilizer EC checks — measure clear water first, subtract the baseline and compare with the product label.
- Penn State Extension: water-quality toolkit — EC estimates dissolved-ion concentration; TDS/PPM is a related conversion and EC is preferred in production.
- University of Missouri Extension: hydroponic nutrient solutions — EC is a proxy for total ions and does not confirm that each nutrient is at the correct concentration.
Use the result in a real grow
This protocol tells you how a bottle changes a controlled sample. For an actual plant, pair it with the complete pH, EC, PPM and runoff guide, the product label and the plant’s response. If two meters disagree or a reading does not make sense, ask HWGrow a question and include the water source, product/dose, meter model, calibration date, temperature and both readings.
HWGrow nutrient-test FAQ
Does the protocol use 50 mL or 500 mL of water?
It uses 500 mL. The old page’s 50 mL statement contradicted the source video and would make the sample ten times more concentrated.
Is 1 mL per 500 mL a feeding recommendation?
No. It is the liquid-product comparison rate, equal to 2 mL/L. Always use the label, your full recipe, source water, medium and plant response for feeding decisions.
Does a PPM meter count individual nutrient molecules?
No. A TDS meter measures electrical conductivity and converts it to a PPM-style number. It does not identify which elements are present.
Why record the water reading first?
The water already contributes pH and conductivity. Recording the baseline lets you calculate the change associated with the added product.
Comments
Leave a reply
You may also like

How to Breed Masterclass – Promo Video

Mars Hydro FC4000 vs Spider Farmer SE4500: Side-by-Side Test




Featured Grow

Looking healthy
Shared a GIF.
kind of looks a little too dry for my liking
of course you will

Growing the Purple Berry's now, hope I do her justice.
This video proves to me that I am in the right place. Data matters!!🫡